Real-Time Trust Illustration
A mockup of how confidence (a.k.a. trust) works alongside the Value Hierarchy.
A Value Hierarchy is one of the primary ways we reduce Bandwidth Tax.
It is similar to Maslow’s Hierarchy of Needs – “blocks” of decreasing relative value that sit, one on top of another, and form a triangle. You’re seeing one-half of that triangle here.
It’s important to note that each level from bottom to top is relatively decreasing the entier time.
- The long side (red line) changes shape based on Trust rated from -1 to 1 where 0 is neutral (and a normal triangle).
- The dotted black lines are each level, or how many “categories” there are.
- The total area under the “triangle” represent the amount of available resource.
- Each point at intersectipon of the right side of the dotted black lines and the red line (x coordinate of each level) represent a weight to assign to each level, depending on trust and the corresponding level.
- Each “weight” represents a proportion of the whole (the area under the “triangle”.
- The proportions between the weights change based on the the amount of confidence, or trust.
- The shaded area in level one is how much resource one might contribute to things in the first level of their “value hierarchy.
Observe how each “level” is relatively different depending on the trust.
Trust in action with…
Money Distribution
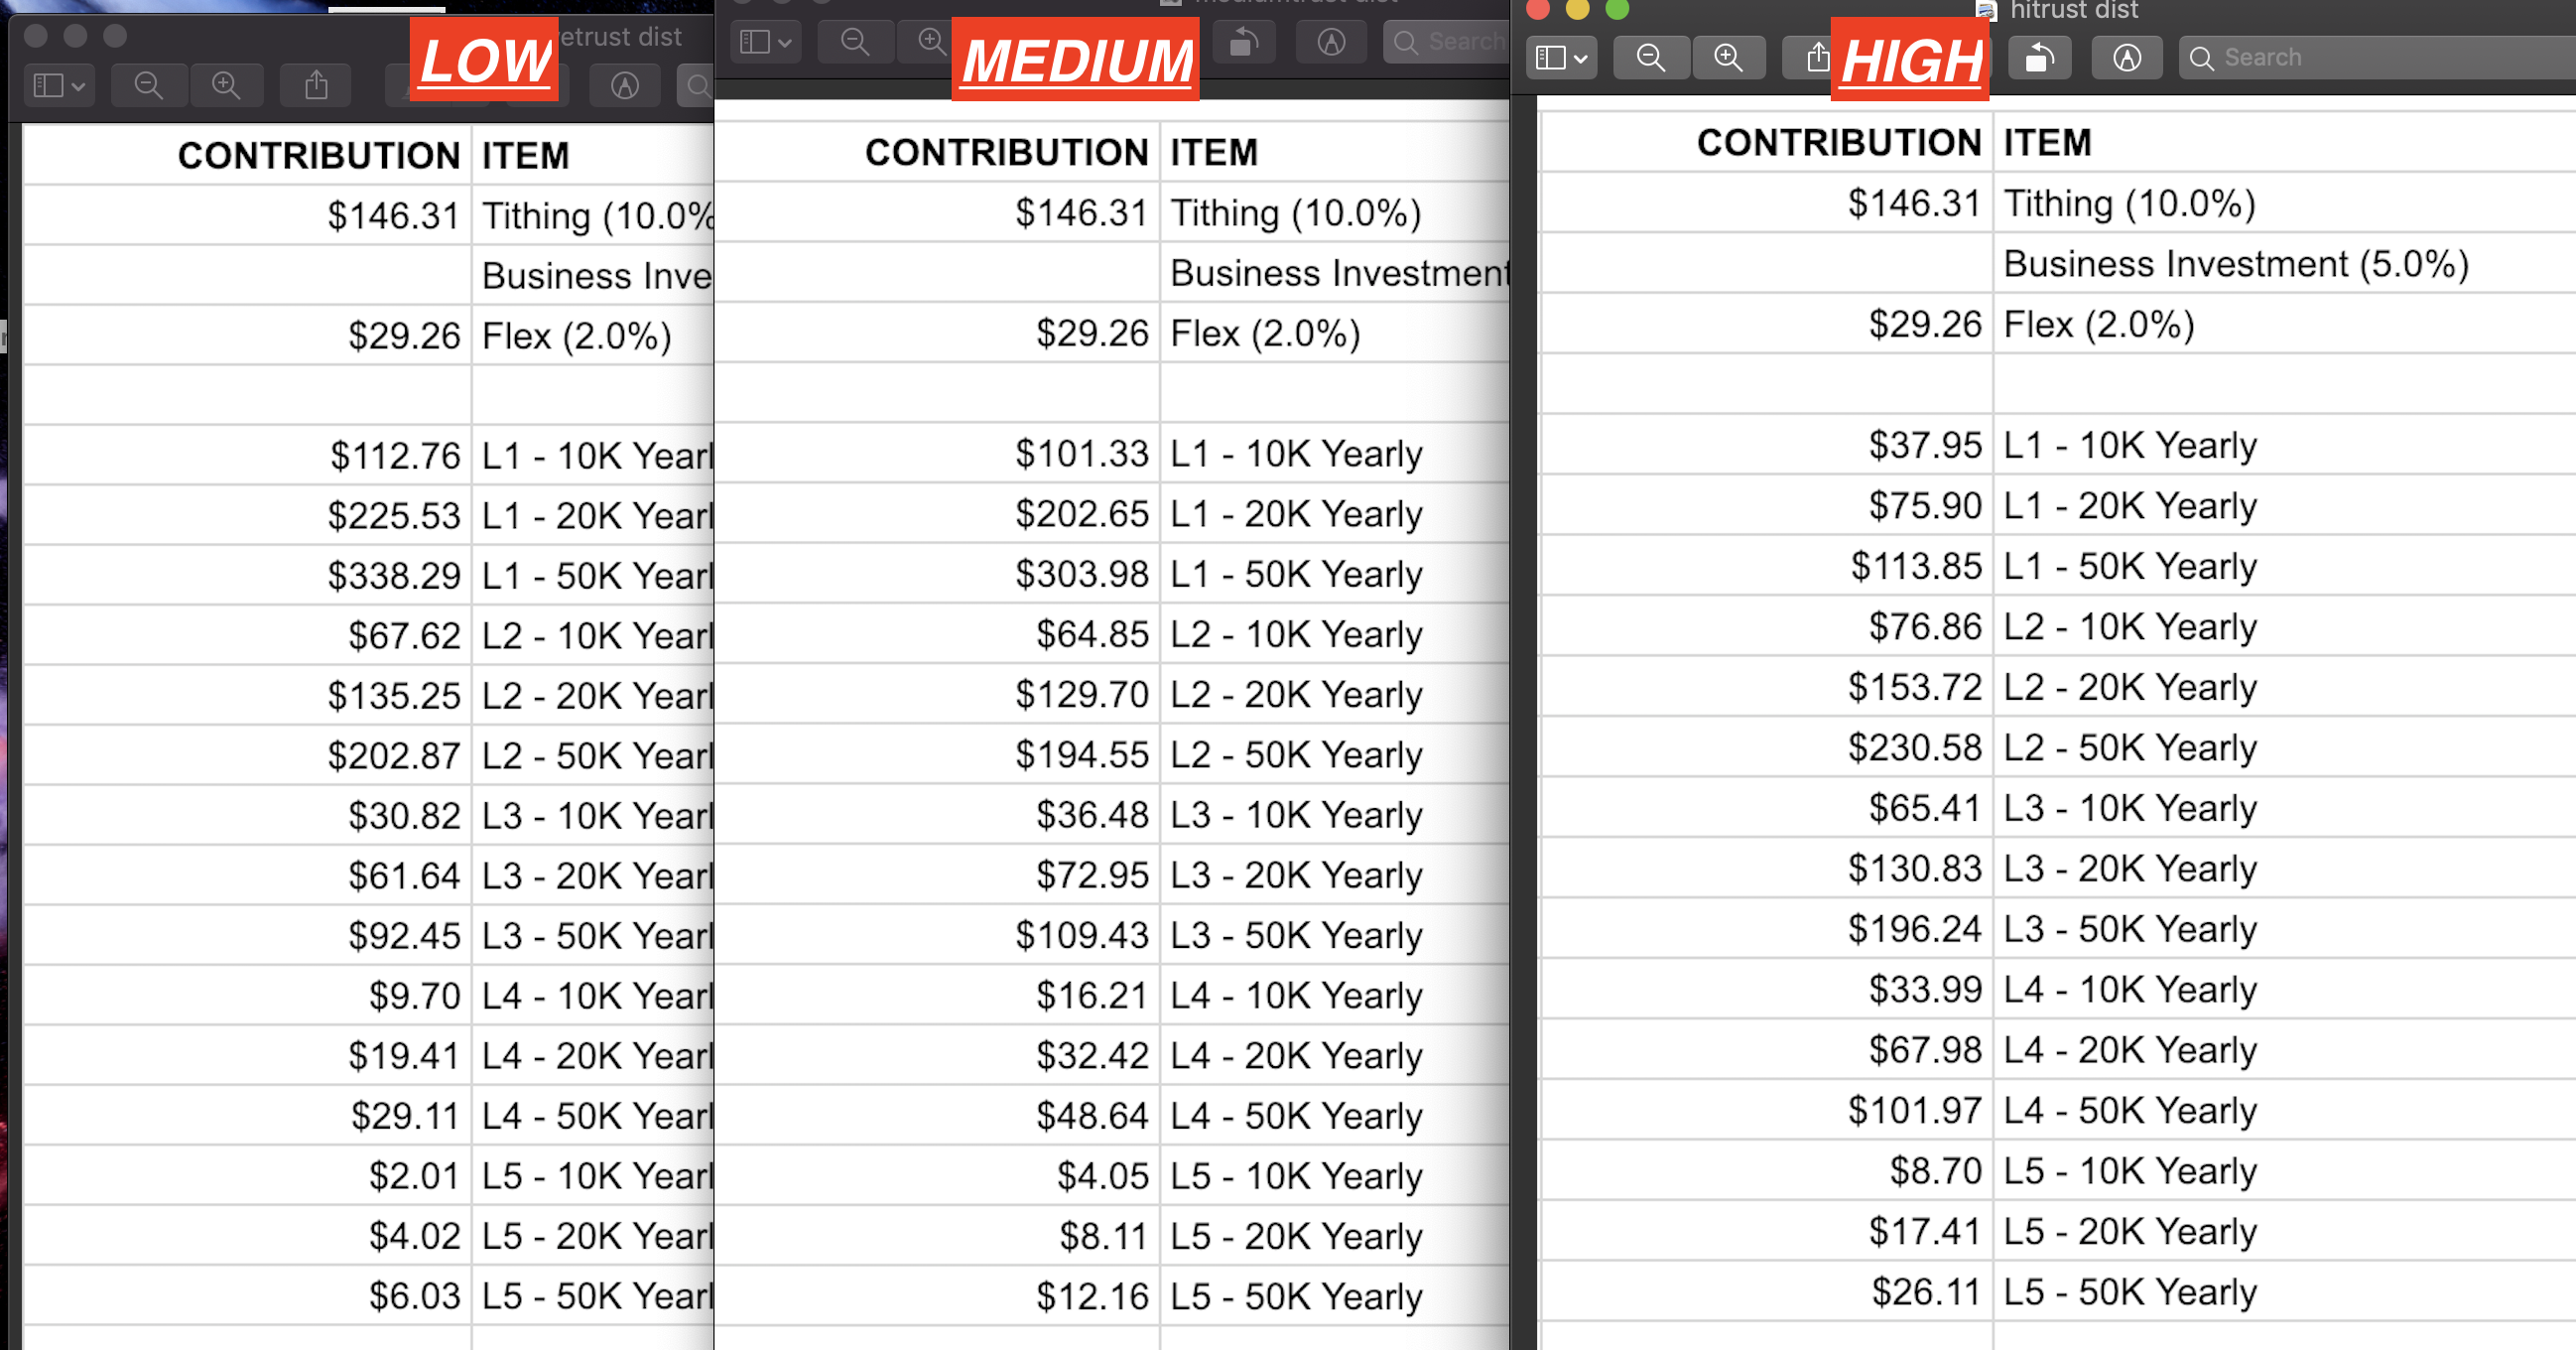
This is the result of that equation – a projection for how to allocate $1,000 in each case – high, medium, and low trust.
These allocations were made entirely using our automated tools. We did no manual figuring, calculating, or adjusting whatsoever.
Trust can be any decimal from -1 to 1. There are no “phases” or “intervals” – it’s entirely flexible.
The percentages on the top come “off the top” of the $1000 before anything else (think gross vs net).
We’ve added three yearly expenses to each level, all with the same desired amount. These represent potential desires.
This edifies that costs are not related in any way to value, but that value controls attention.
You’ll notice that money is allocated differently to each level depending on the amount trust one has.


